
Page 19 - Judicial Diversity Update report
P. 19
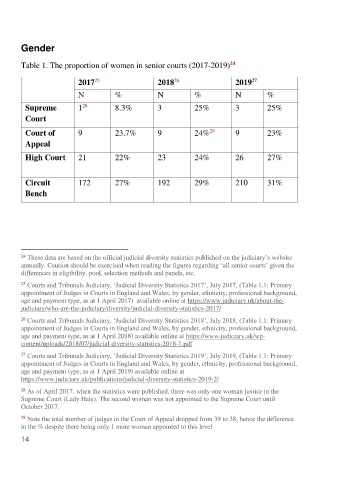
Gender

                                                               24
       Table 1. The proportion of women in senior courts (2017-2019)
                                                26
                          25
                      2017                 2018                 2019
                                                                     27
                      N         %          N         %          N        %
        Supreme       1         8.3%       3         25%        3        25%
                       28
        Court
        Court of      9         23.7%      9         24%        9        23%
                                                         29
        Appeal
        High Court    21        22%        23        24%        26       27%


        Circuit       172       27%        192       29%        210      31%
        Bench


       24  These data are based on the official judicial diversity statistics published on the judiciary’s website
       annually. Caution should be exercised when reading the figures regarding ‘all senior courts’ given the
       differences in eligibility, pool, selection methods and panels, etc.
       25  Courts and Tribunals Judiciary, ‘Judicial Diversity Statistics 2017’, July 2017, (Table 1.1: Primary
       appointment of Judges in Courts in England and Wales, by gender, ethnicity, professional background,
       age and payment type, as at 1 April 2017)  available online at https://www.judiciary.uk/about-the-
       judiciary/who-are-the-judiciary/diversity/judicial-diversity-statistics-2017/
       26  Courts and Tribunals Judiciary, ‘Judicial Diversity Statistics 2018’, July 2018, (Table 1.1: Primary
       appointment of Judges in Courts in England and Wales, by gender, ethnicity, professional background,
       age and payment type, as at 1 April 2018) available online at https://www.judiciary.uk/wp-
       content/uploads/2018/07/judicial-diversity-statistics-2018-1.pdf
       27  Courts and Tribunals Judiciary, ‘Judicial Diversity Statistics 2019’, July 2019, (Table 1.1: Primary
       appointment of Judges in Courts in England and Wales, by gender, ethnicity, professional background,
       age and payment type, as at 1 April 2019) available online at
       https://www.judiciary.uk/publications/judicial-diversity-statistics-2019-2/
       28  As of April 2017, when the statistics were published, there was only one woman justice in the
       Supreme Court (Lady Hale). The second woman was not appointed to the Supreme Court until
       October 2017.
       29  Note the total number of judges in the Court of Appeal dropped from 39 to 38, hence the difference
       in the % despite there being only 1 more woman appointed to this level.
       14